
With Q2 officially in the books, we pulled our own numbers to answer a question developers ask us pretty often: “What’s your typical Jest user?”
The honest answer is: there isn’t one.
The user mix on Jest shifts constantly because user acquisition (UA) is targeted at whatever audience is right for the app being promoted. One month, the active base might skew female among users aged 40–65; the next, males 25–40. Any app can succeed on Jest, and a successful launch can reshape the “average” Jest user around it.
That’s the point. Whether we’re running UA or you are, we’re targeting the audience your app needs — not whoever happens to be on Jest today.
Still, as the portfolio has grown and shifted, a few things have stayed fairly consistent. Here’s what Q2 2026 looked like.
Jest is currently live in the U.S. only, so all of these numbers reflect a U.S. audience.
1. Effectively all mobile, with a tilt toward Android
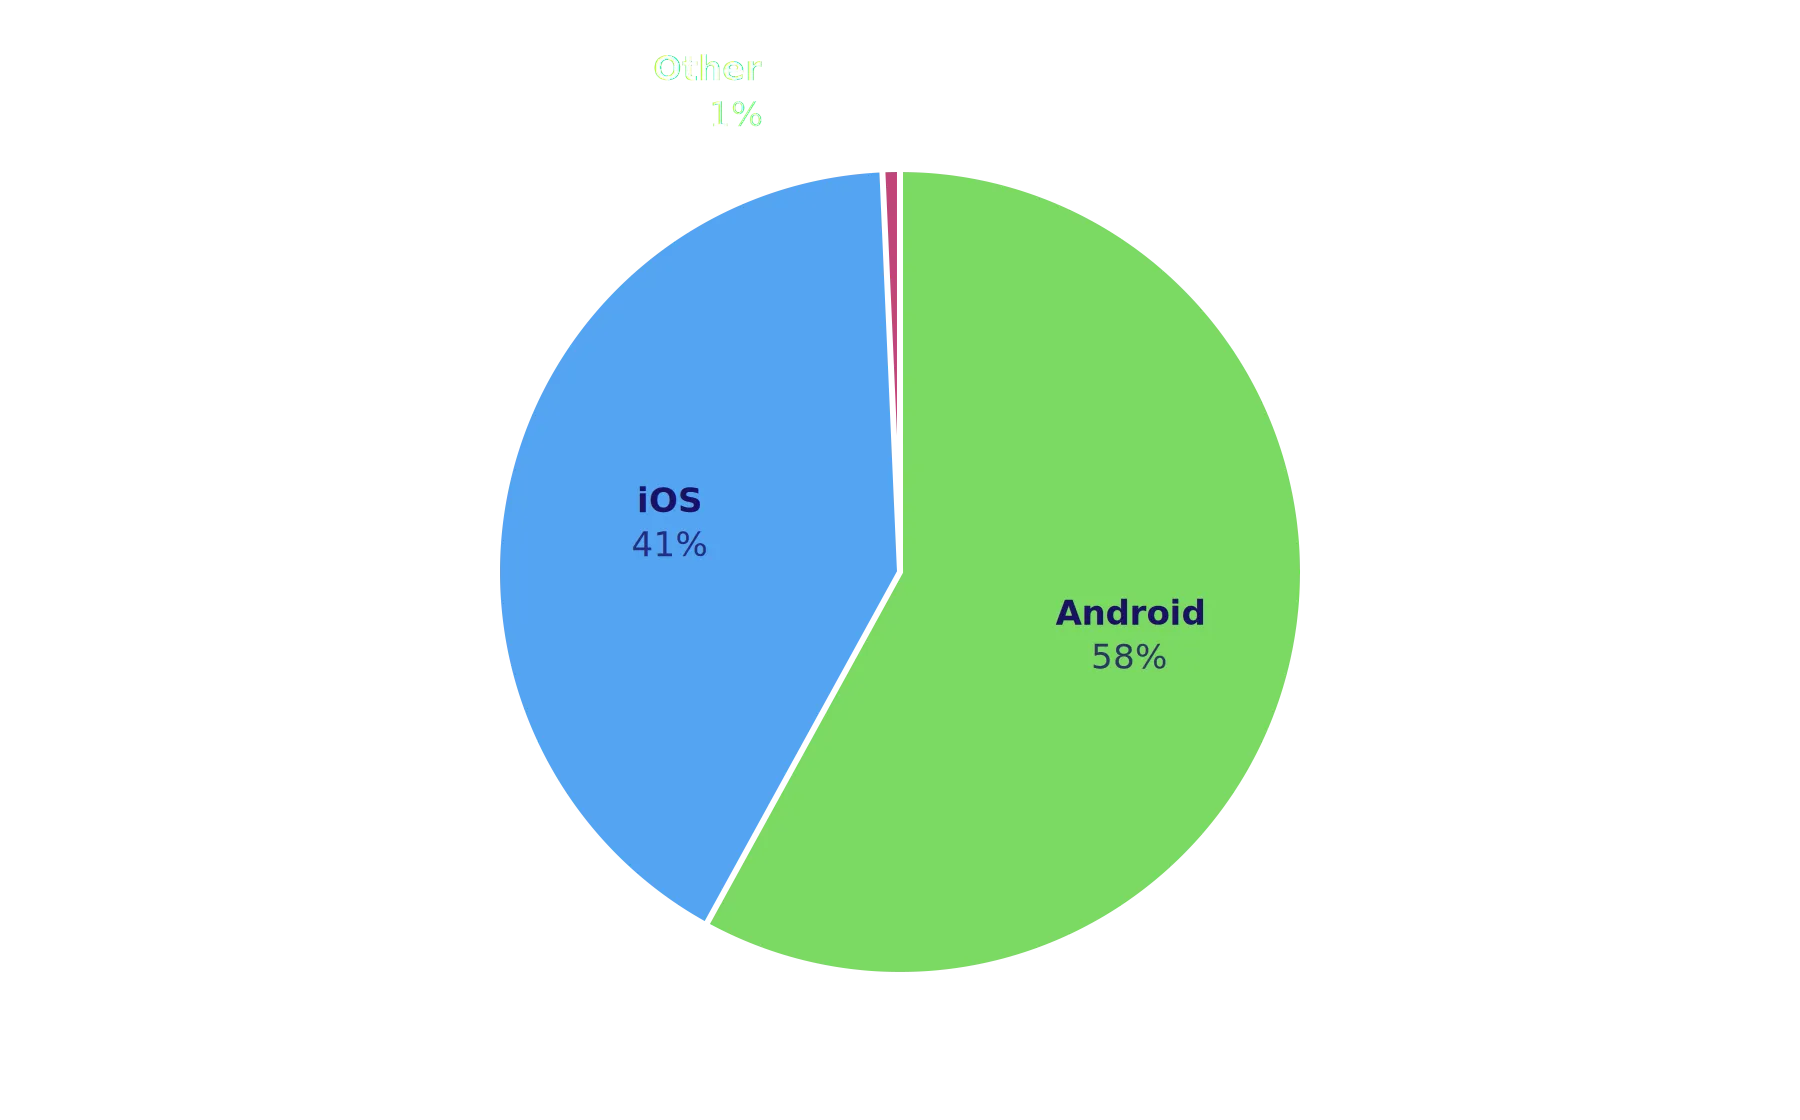
About 99% of active users in Q2 were on phones, split 58% Android and 41% iOS. That’s close to the inverse of the U.S. smartphone market, where iPhone holds the larger share.
Android vs. iOS: what Jest users are on
Source: Jest platform data, April 1 – June 30, 2026.
2. Carriers look a lot like the national market
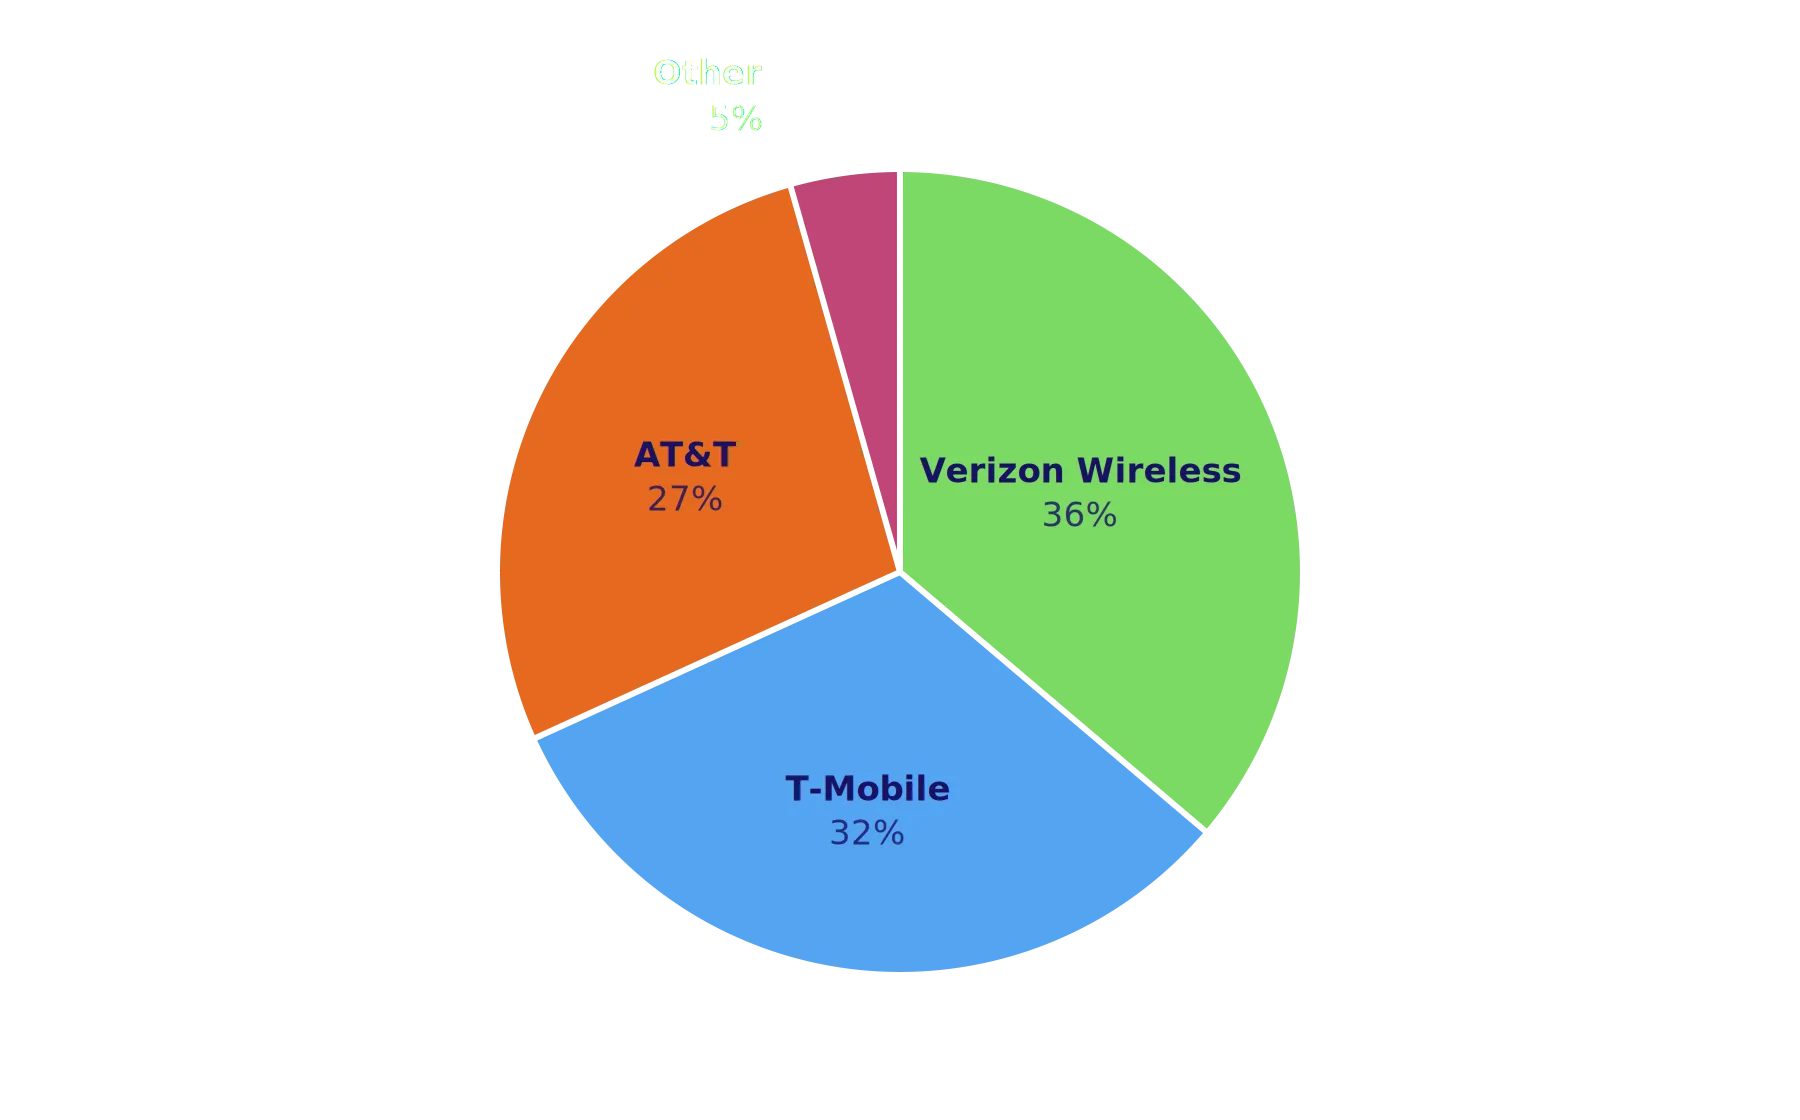
Verizon accounted for 36% of users, T-Mobile 32%, and AT&T 27%. Together, the three major carriers represented about 95% of the user base, broadly in line with their U.S. market share.
Which carriers Jest messages reach
Source: Jest platform data, April 1 – June 30, 2026.
3. RCS has taken over
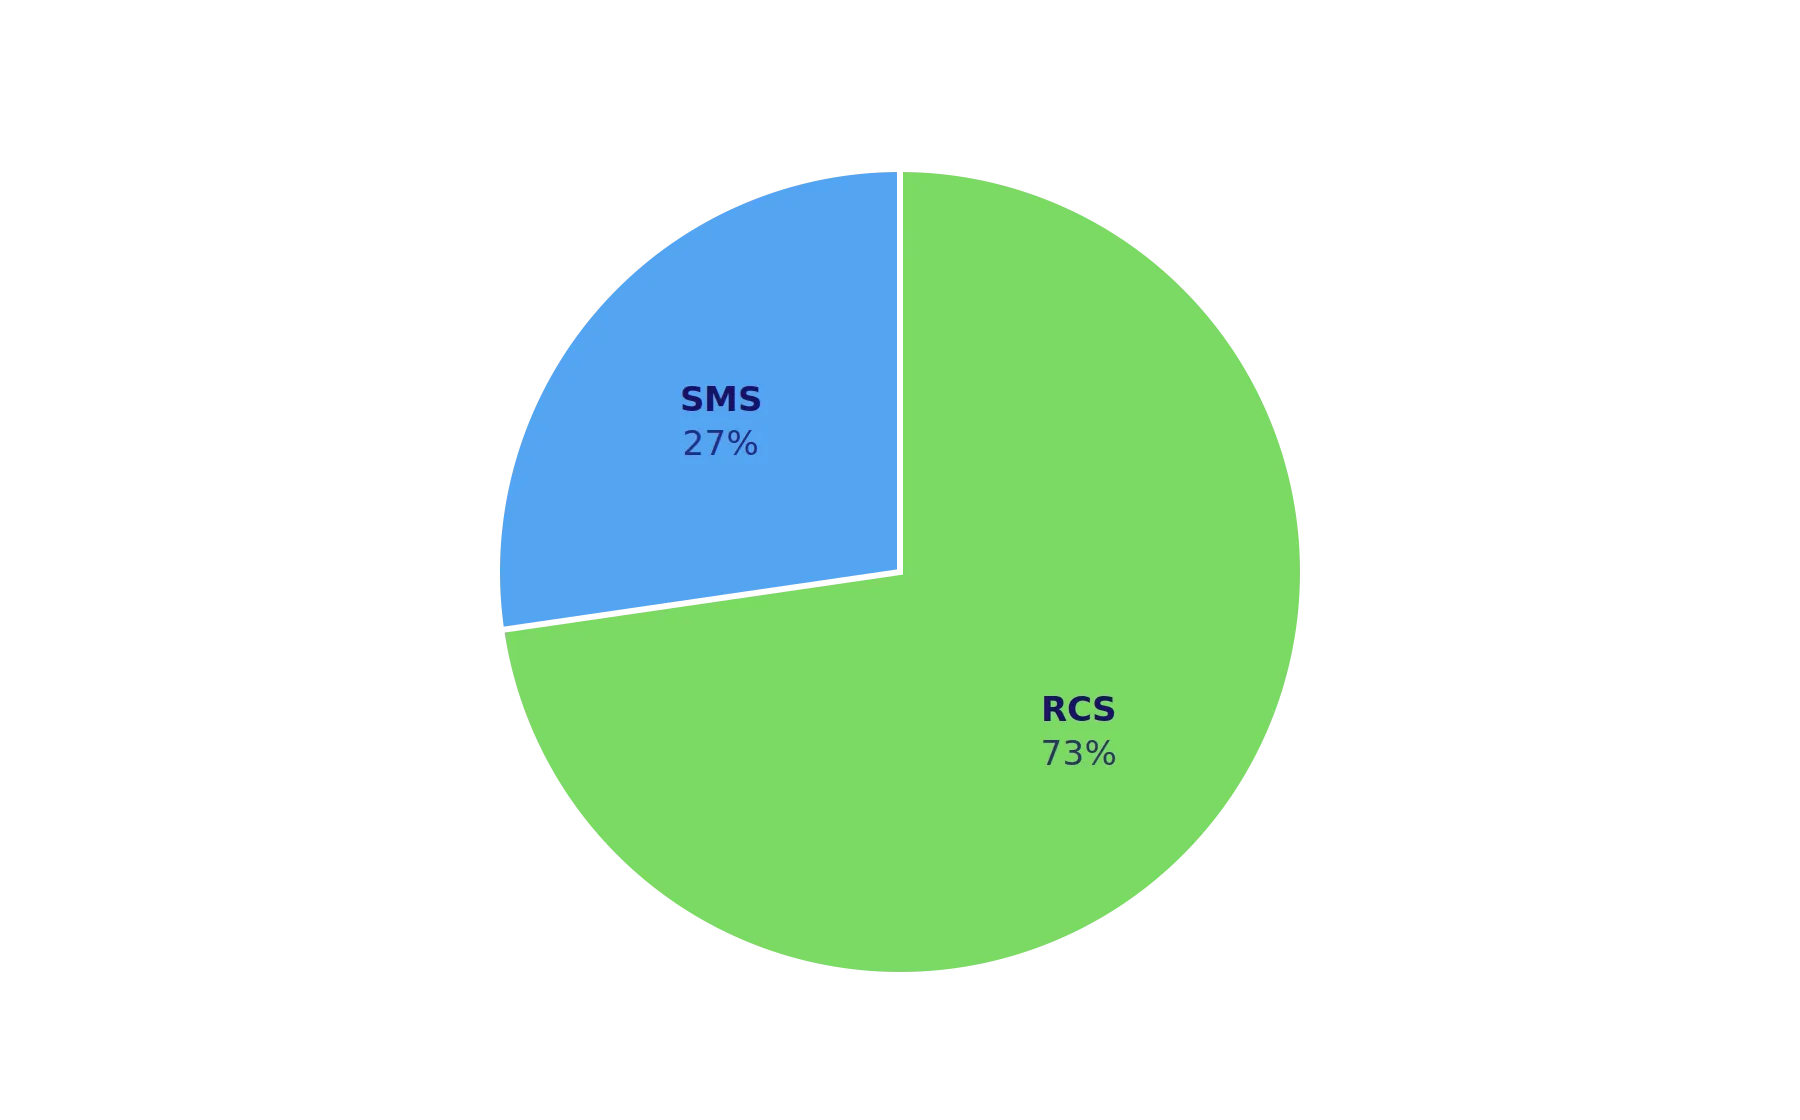
About 73% of users received messages from Jest over RCS, compared with 27% over SMS. We expect that gap to widen further in the second half of the year as RCS adoption continues to grow.
RCS vs. SMS: how Jest messages get delivered
Source: Jest platform data, April 1 – June 30, 2026.
4. Users are spread across the country
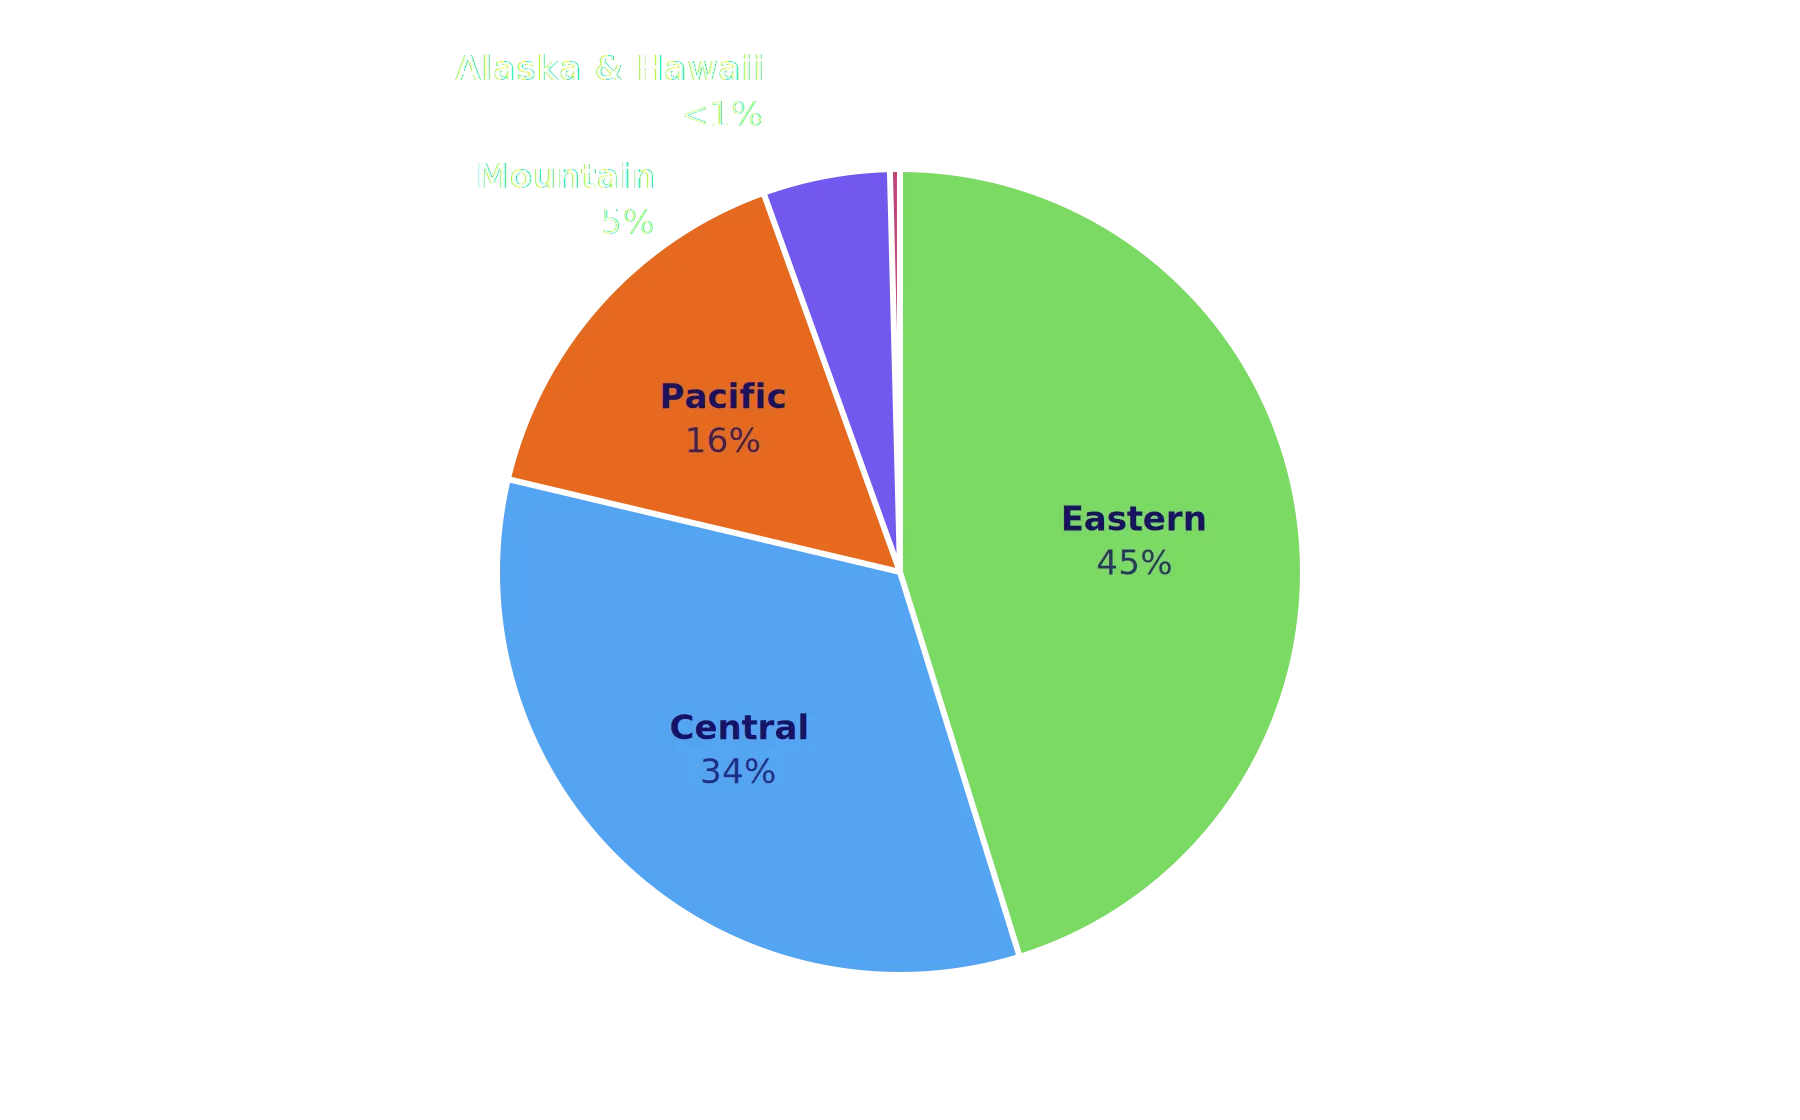
Eastern 45%, Central 34%, Pacific 16%, and Mountain 5%. That’s within a few percentage points of how the U.S. population itself is distributed across time zones.
Where Jest users are, by U.S. time zone
Source: Jest platform data, April 1 – June 30, 2026.
5. There’s no prime time
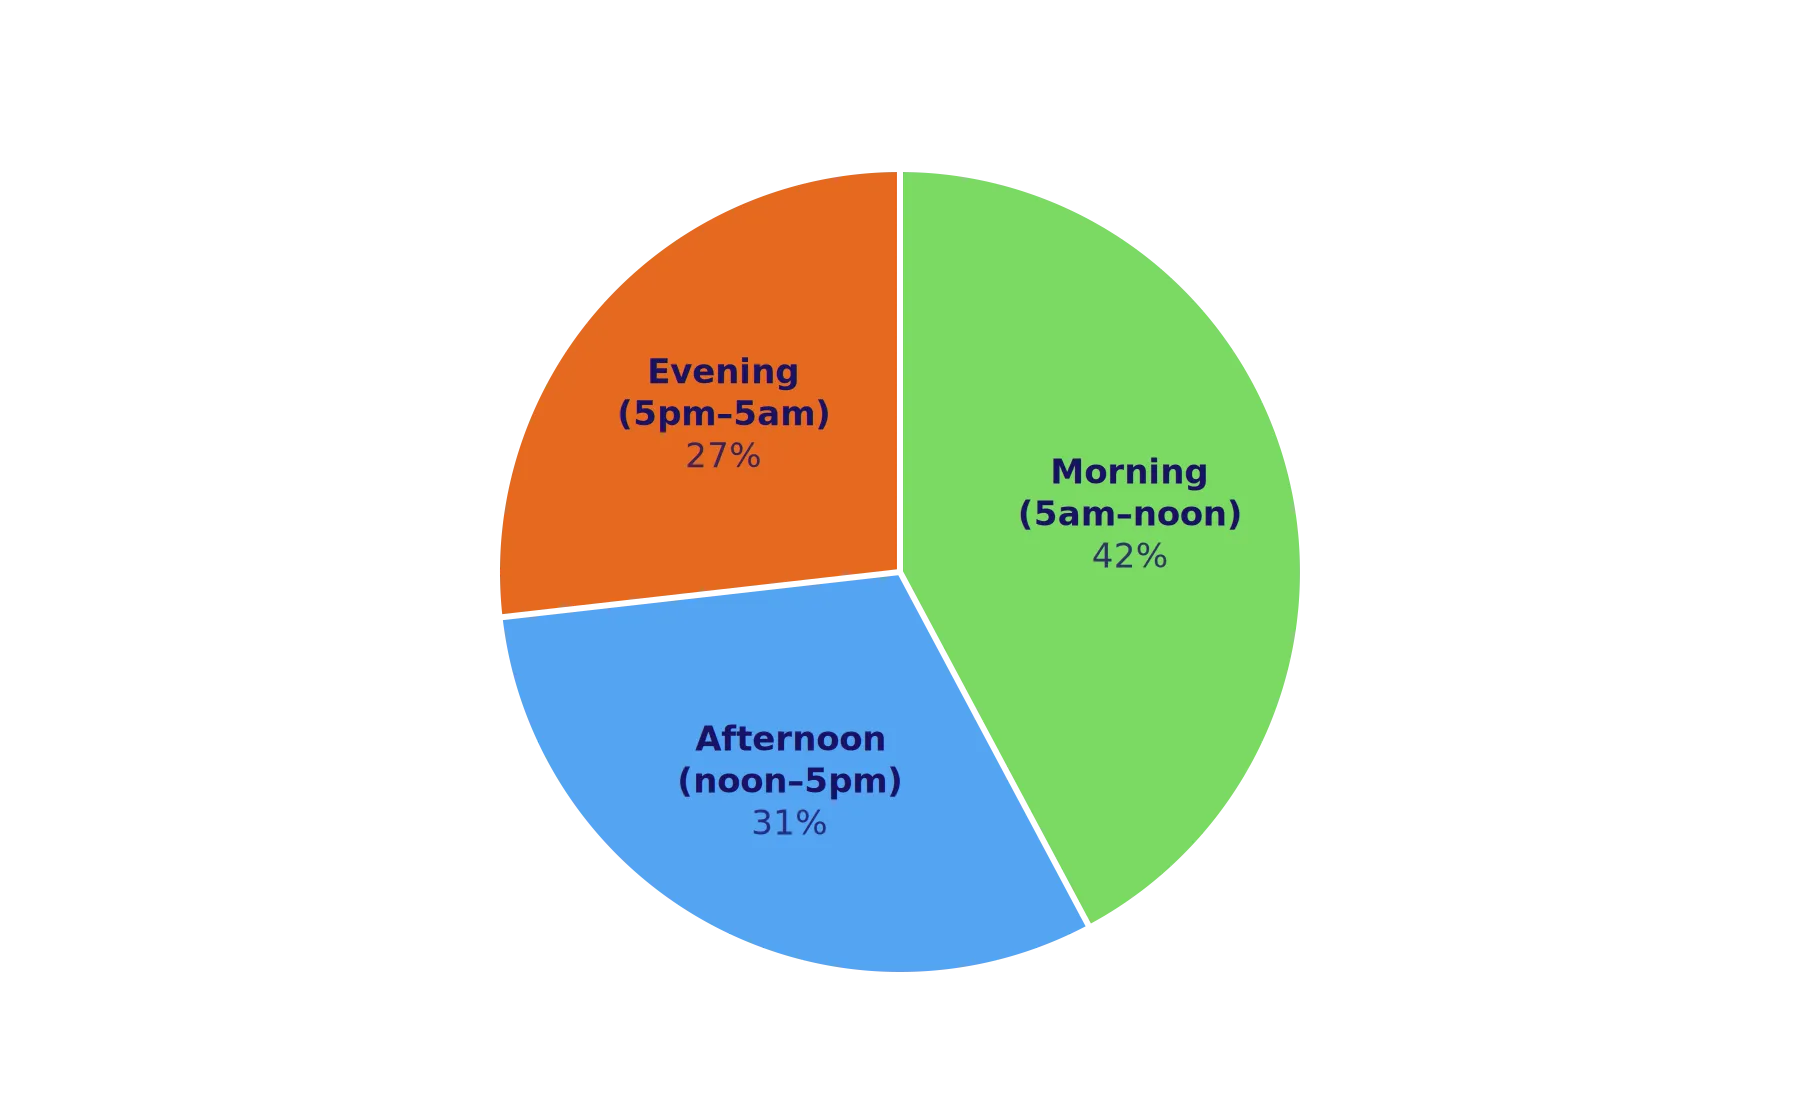
App entries ran 42% in the morning (5am–noon), 31% in the afternoon (noon–5pm), and 27% in the evening/overnight, with time-of-day buckets based on each user’s local time.
Mornings are the most popular, but the bigger takeaway is that users are active around the clock.
When users open apps, in their own time zone
Source: Jest platform data, April 1 – June 30, 2026.
One more caveat: these are Q2 2026 snapshots, not a spec sheet. As Jest grows and the mix of apps on the platform changes, these numbers will move too.
So if you’re building on Jest, don’t design for the average user. Design for yours, and we’ll help you find them.
Want to learn more about building on Jest? Our developer docs are open to everyone, and the launch checklist covers what you need before you submit.